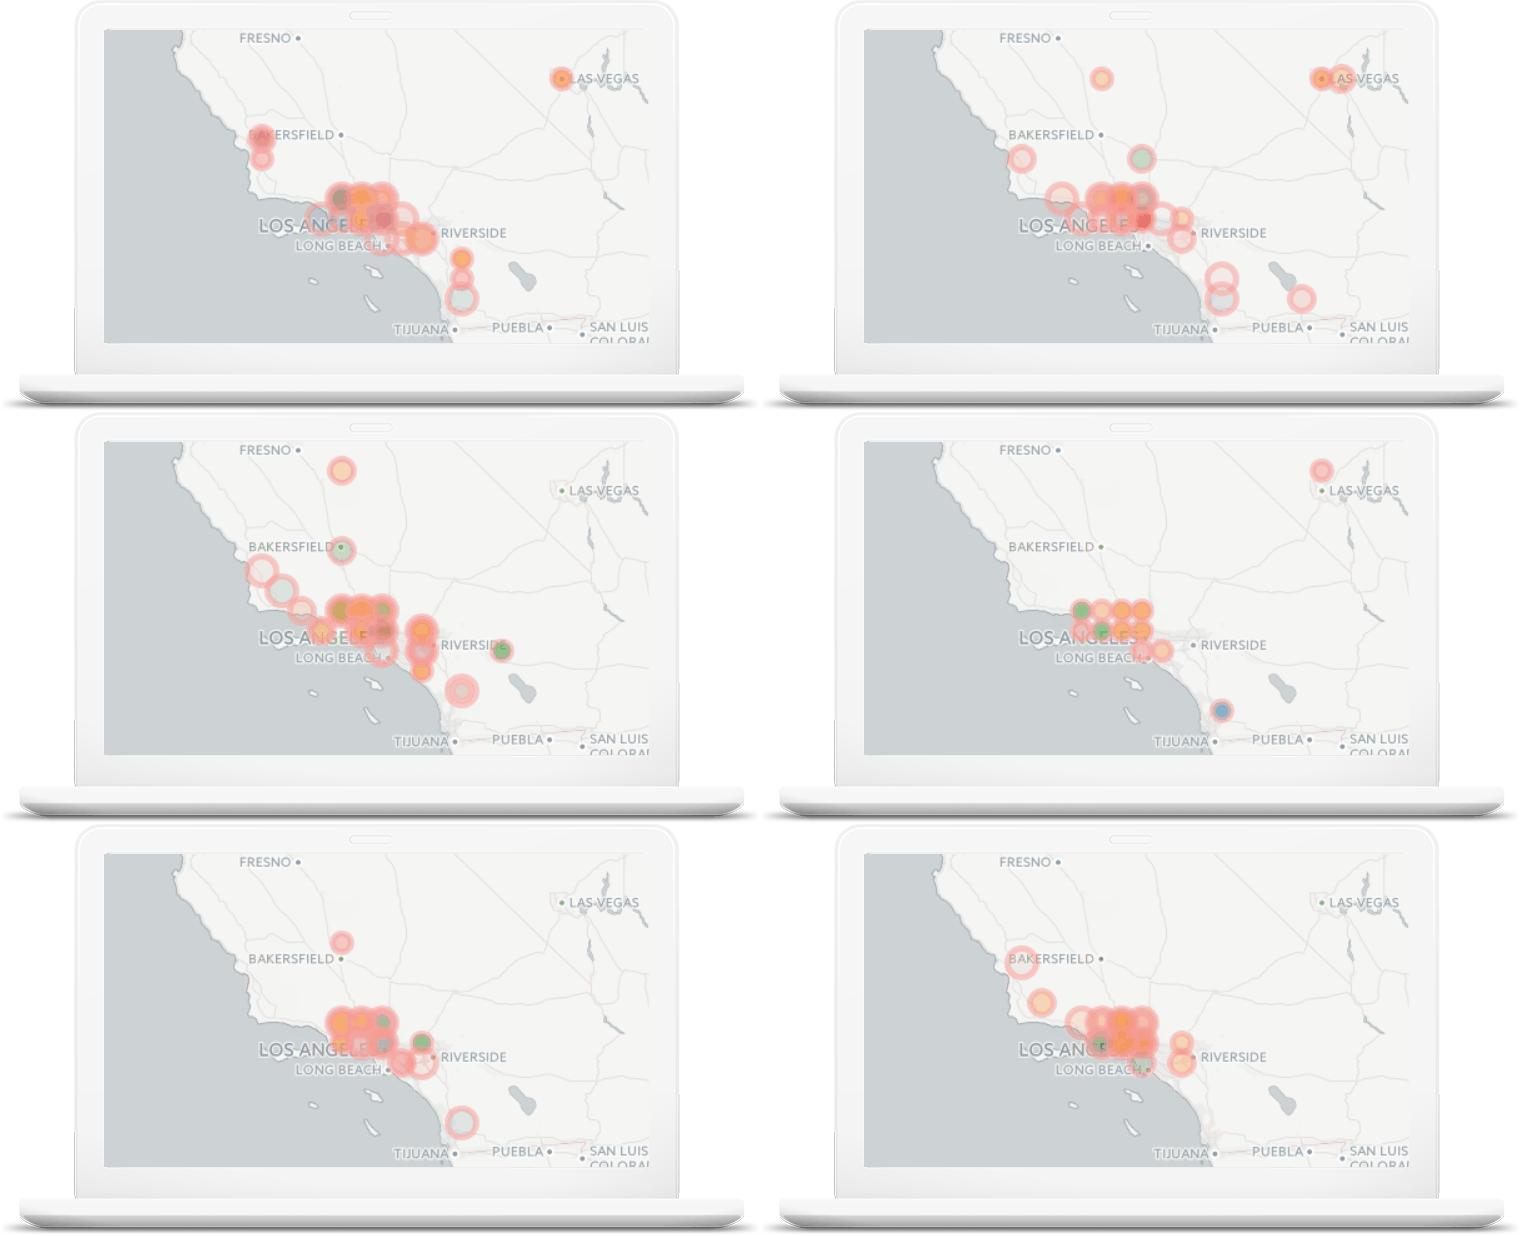
Trend Monitor
Get connected and stay connected
Trend Monitor automatically tracks your key customer metrics across your locations and combines them with powerful insights and intuitive color-coding to alert you to significant changes in leading performance indicators. Identify a sharp decline in loyalty or a significant reduction in your best customers before your location sales start to decline. Get the jump on your competition by identifying a market opportunity or a significant shift in your customer preferences.

“In our business, identifying trends is critical. Trend Reports help us track and monitor our key performance metrics and benchmark them across all of our locations.”
Santikos Entertainment, TX
BENEFITS
Focus on only what matters most with one simple dashboard.
Easily identify, benchmark, and track important trends like customer loyalty, peak days and seasonal traffic. Stay on top of key performance metrics across customers, locations, and time. Establish push reporting at your own cadence and share interactive visualizations that can be accessed across all types of devices.
Sales Distribution – How customers patronize across your locations. Respond to who is choosing you and track the ones you are targeting. Better manage each location and assess the impact of your marketing and promotional efforts on your customer mix.
Customer Frequency – How frequently customers patronize across your locations. Keep tabs on your most loyal customers. Validate the lift of your loyalty and promotional efforts intended to increase the frequency of all of your customers.
Day of Week – When customers spend, by day, by location. Track your peak days and compare your weekday and weekend customers. Identify periodic market opportunities and better manage your location capacity.
Customer Value – Assess customer value, by location with our Customer Value Score™. This composite score combines spend and frequency to help you identify high and low value customers. Use it to help you make decisions on investments like advertising, promotions, and expansion.
Average Spend – How much customers spend across your locations. Note the ones that spend the most and the least. Get indication as to whether you should make a temporary or permanent change in your prices, inventory, or items sold.
Market Penetration – Benchmark and monitor market penetration by customer type, by location with our Market Penetration Score™. This indexed score measures how well you are penetrating your market. It can provide indication of market awareness and the degree to which each customer type likes you. It is also helpful in comparing location performance and in assessing market effectiveness.
Industry Segmentation
This product includes our intuitive Industry Segmentation wherein we take thousands of characteristics, attributes, and preferences and filter it down to only what is insightful to you based on your industry. Here a few examples. Let us know if you are looking for something specific that you don’t see below.
Industry Preferences
Which customers prefer beer versus wine? Which ones like takeout? Which ones enjoy snacks and appetizers?
Brands
What other places do they shop or eat at? How much do they spend in that category?
Leisure & Interests
Who likes sports and outdoor activities? Which ones like hiking or golfing? Who likes going to the movies? Which customers enjoy civic involvement? Which ones own pets?
Demographics & Economics
Who has a blue-collar occupation. Who has a tendency to save? Are they college educated?
Attitudes
Who are the early adopters? Which ones view marketing as more deceptive than informative? Which ones try to eat healthy?
Lifestyle
Identify green shoppers. Is their shopping influenced by their kids? Do they travel, go to nightclubs, or eat fast food?
