Market Vision
See the entire picture
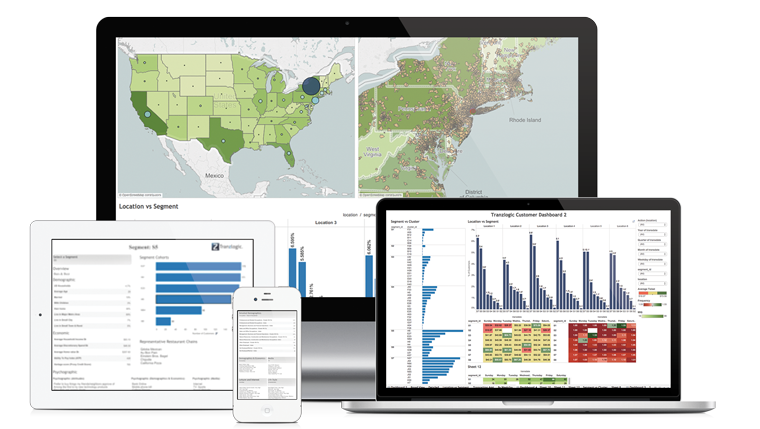
Market Vision’s dynamic maps and intuitive dashboards give you an ongoing interactive view into the market as a whole. Get to know your customers and everyone else in the neighborhood. Define and explore your unique markets, manage your locations according to regional trends, and identify new markets rich in your ideal customers.
“We don’t do marketing. We stay relevant by adapting to the tastes and preferences of the guests at each of our locations—information we could only have learned with the insights from Tranzlogic.”
The Meatball Shop, NY
BENEFITS
Get connected and stay connected
Market Vision uses industry specific segmentation to combine your customer data with rich market data so that you can focus on what matters most. Whether you have one, or many locations. Whether your market is large or small. Market Vision gives you the tools and insights to get connected and stay connected.
Market Definition: Identify and understand your unique market. See how big your market is, where your customers live, and how far they travel. Track how and when they spend across one, many, or all of your locations.
Market Performance: Benchmark and track your performance over time. Use the Market Penetration Index to assess how much customers like you and to determine how you are performing relative to the addressable market opportunity.
Market Preferences: Drill down into industry specific segmentation to learn everything you need to know about the households in an area. Become familiar with the preferences, attitudes, and interests of both your customers and their neighbors.
Market Trends: Identify and monitor trends such as peak days and seasonal traffic. Track key performance metrics like sales distribution, average ticket and frequency across customer segments, locations, geography, and time.
Market Management: Make decisions based on the tastes, preferences, and regional trends of your customers and your neighborhoods. Vary the items you sell, manage inventory and pricing, and establish your décor based on your unique markets.
Market Exploration: With access to all of the household data across the country you can run counts and size up markets, explore opportunities to target new customers and identify where you may want to open new locations.
Industry Segmentation
Industry Segmentation intuitively distinguishes those customers, markets, and regions of importance and enables you to focus on the things about them that are relevant to you.
Industry Preferences
Which customers prefer beer versus wine? Which ones like takeout? Which ones enjoy snacks and appetizers?
Brands
What other places do they shop or eat at? How much do they spend in that category?
Leisure & Interests
Who likes sports and outdoor activities? Which ones like hiking or golfing? Who likes going to the movies? Which customers enjoy civic involvement? Which ones own pets?
Demographics & Economics
Who has a blue-collar occupation. Who has a tendency to save? Are they college educated?
Attitudes
Who are the early adopters? Which ones view marketing as more deceptive than informative? Which ones try to eat healthy?
Lifestyle
Identify green shoppers. Is their shopping influenced by their kids? Do they travel, go to nightclubs, or eat fast food?